Teacher Reporting Dashboard
The Teacher Dashboard is available only for the assigned religion Teacher, assigned Team Teachers, the Center Administrator and the Diocese Executive. This post will guide you through the key components of the report.
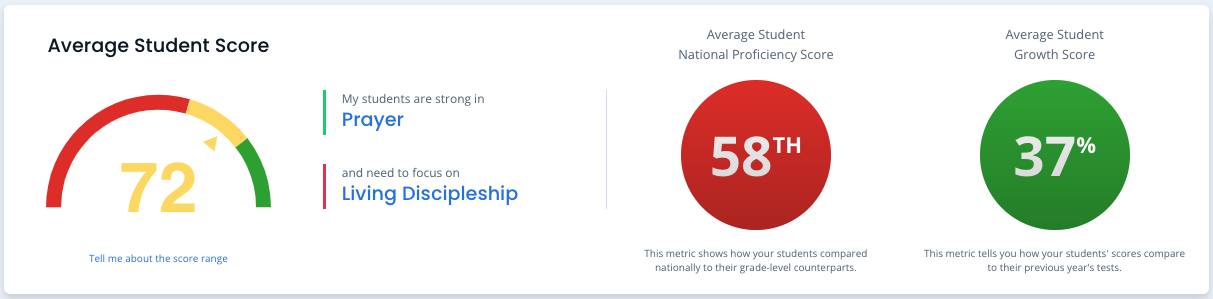
The Summary Diagnostic
Here you see a summary of your students' strongest and weakest Domains, along with the average Knowledge score, National Percentile, and Belief & Behavior alignment score of all students you taught this year.
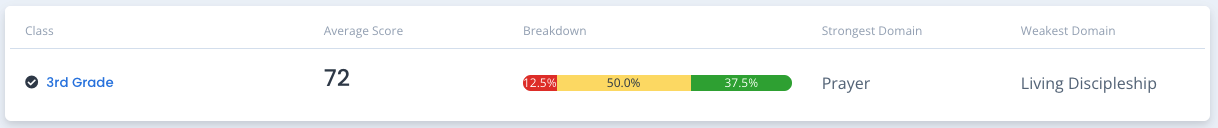
Class Overviews:
The Class Overviews show a listing of your class(es), including average student score, and the Breakdown shows the percentage of students scoring in 5 score ranges (1-19 red, 20-39 orange, 40-59 yellow, 60-79 pale green, 80-100 green.) You will also see the strongest and weakest Domain for each class. Clicking the pivot reveals the top-3 missed questions in the class. If you have more than one class, click the class name to view its detailed results.
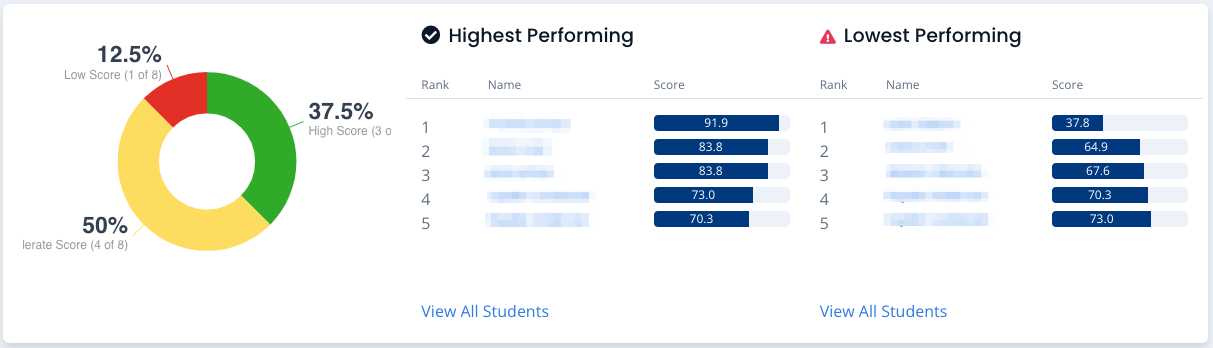
Student Scores
Here you will see the percent and count of all your students scoring in 5 score ranges (1-19 red, 20-39 orange, 40-59 yellow, 60-79 pale green, 80-100 green.) Then the students are listed by highest and lowest scores. Clicking “View All Students” will show your entire roster ranked top to bottom or bottom to top. Click on any name to go to that student’s individual results.
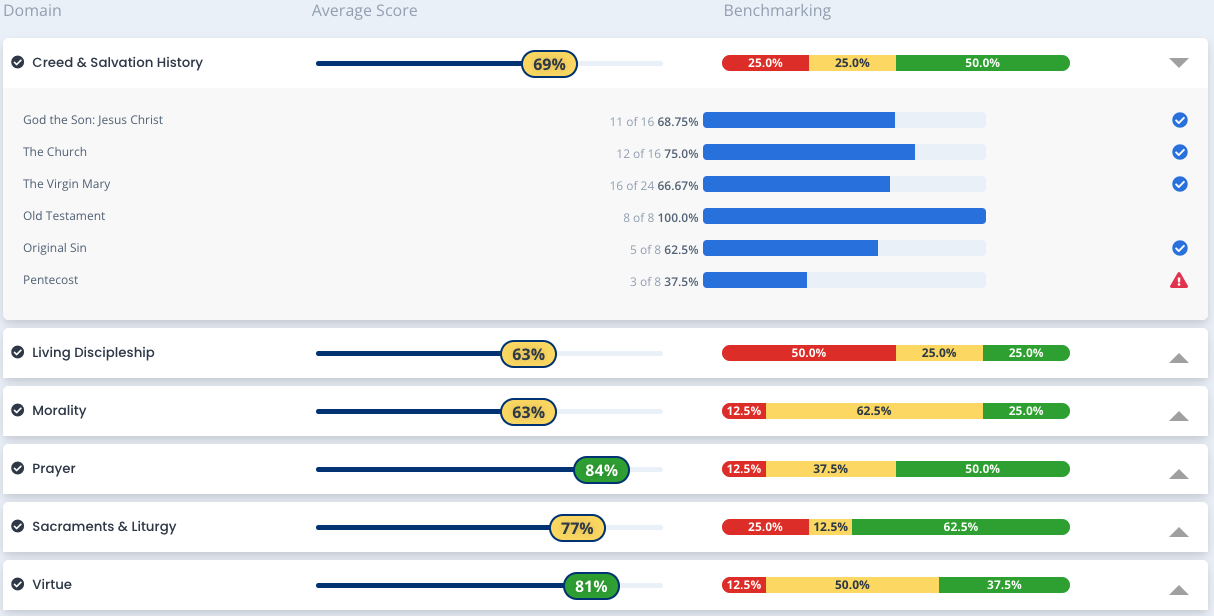
Domain Scores
Here, the class’s knowledge and belief alignment scores across the six tested Domains are summarized. This includes a count and percent of students who scored 1-19 red, 20-39 orange, 40-59 yellow, 60-79 pale green, 80-100 green. When you pivot the Domain title with the button, you can see the topics covered and the students’ correct response rate.
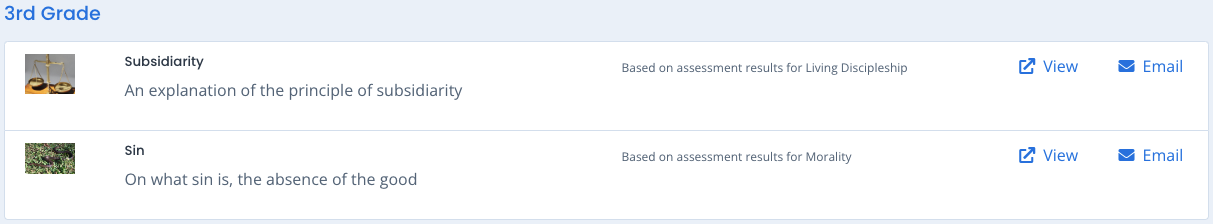
Lesson Recomendations
This section includes two free resources per class to support that class based on the its weakest Domain on the ARK assessment. You can view these in a new window, or email them as needed.
Related Articles
Diocese Executive Reports Dashboard
The Diocese Executive Dashboard is available only for the assigned Diocese Executive. This post will guide you through the key components of the report. Summary Diagnostic Here you see the average knowledge score of all Students in your diocese ...Reporting FAQ
Q. When will I get my results? A. You will be able to see your results a few weeks after the national testing window closes (Mid-may) Q. How do I print my results? A. To print an individual score report, go to that student or teacher report and click ...Teacher Performance Report
The Teacher Performance Report is available only for the Center Administrator and the Diocese Executive. This post will guide you through the key components of the report. Teacher Results Here you see a summary of the selected teacher’s knowledge ...Center Administrator Reports Dashboard
The Center Administrator Dashboard is available only for the the Center Administrator and the Diocese Executive. This post will guide you through the key components of the report. School Snapshot Here you see your school’s Catholic Identity Score, ...Academic Reporting: Parent Report Explainer
The attached document can be printed and shared with the individual student report to help explain the content or the report and what is being measured for each student.